ChestXRay_Multiclass_Detection
Chest X-Ray Multi-Class Object Detection:
RT-DETR, DINO, Detector Collaboration and Ensembling
Vahe Sokhoyan
July 2026
Overview
Chest X-ray multi-class object detection remains a challenging problem due to substantial inter-class variability, annotation inconsistencies, severe class imbalance, and the need to balance localization precision and detection recall. This report summarizes a machine learning pipeline developed for the AMIA 2026 Imaging Informatics Challenge at Kaggle, achieving a 3rd-place on the final private leaderboard. The work combines detector development, systematic experimentation, model ensembling, and post-processing into a unified detection framework.
Several state-of-the-art detector architectures were investigated. RT-DETR models were trained using both ADAM and MuSGD optimization schemes, while DINO detectors were evaluated under a broad range of configurations, from conventional fine-tuning to largely unfrozen backbones. Additional VLM-based experiments focused on semi-automatic annotation refinement and dataset cleanup. Although these methods consistently improved validation quality and annotation consistency, the improvements did not transfer to the hidden leaderboard, providing useful insight into the limitations of validation-driven optimization under distribution shift. The report also studies the evolution of detector behaviour during training. Early checkpoints generally achieved higher recall, whereas later checkpoints became increasingly precision-oriented. Detector complementarity is investigated on both global and class-specific levels. RT-DETR and DINO showed distinct localization characteristics and different strengths across disease classes, suggesting that collaboration between detector families can be more effective than relying on a single architecture.
A major part of the study is devoted to post-processing. Several reranking strategies are examined, including precision-oriented support, class-specific confidence calibration, detector collaboration, and confidence-guided refinement. Together, these methods constitute one of the main methodological contributions of this work. The report concludes with a discussion of detector complementarity, annotation quality, validation-to-leaderboard transfer, and practical lessons learned for future medical object detection challenges.
Keywords: Chest X-ray, Medical Image Analysis, Multi-Class Object Detection, RT-DETR, DINO, Detector Ensembling, Confidence Reranking, Detector Complementarity, Annotation Quality, Distribution Shift, Error Analysis
Task definition and initial data preparation
The task was formulated as multi-class object detection on chest X-ray images. Each input image could contain zero or more bounding boxes belonging to one of 14 abnormality classes. The original competition annotations were provided in CSV format with image identifiers, class labels, and bounding-box coordinates in the native image coordinate system. Images without pathological findings were represented by a dedicated “No finding” class, which was excluded from detector training because the object detection model was trained only on explicit bounding-box annotations.
The initial data preparation followed the standard conversion of the competition format into an Ultralytics-compatible detection dataset. First, image identifiers were normalized by removing file extensions and using the resulting stem as a common image key. Image dimensions were read from the provided image-size table and stored in a lookup dictionary, allowing each annotation to be converted from absolute pixel coordinates into normalized YOLO-style coordinates. For every annotated box, the original coordinates were clipped to the valid image range, invalid boxes with non-positive width or height were removed, and the remaining boxes were represented by class index, normalized box center, normalized width, and normalized height. The training images were split into cross-validation folds using K-fold splitting with a fixed random seed. For each fold, a separate directory structure was created with train and validation image folders and corresponding label folders. Images were linked or copied into the fold-specific dataset directory, while one label text file was written per image. Images without valid bounding boxes received an empty label file. A fold-specific data.yaml file was then generated, defining the dataset root, train and validation image paths, the number of classes, and class names. This produced a self-contained dataset for each fold that could be passed directly to the detector training pipeline.
Before any model optimization was performed, the pipeline also included basic reproducibility and consistency steps. Random seeds were fixed for Python, NumPy, and PyTorch. The runtime environment, CUDA availability, GPU information, PyTorch version, and Ultralytics version were printed for traceability. Separate output directories were created for fold-specific datasets, training runs, exported model weights, prediction caches, submissions, and experiment summaries. This ensured that each fold could be trained, evaluated, and later traced back to its exact data split and configuration.
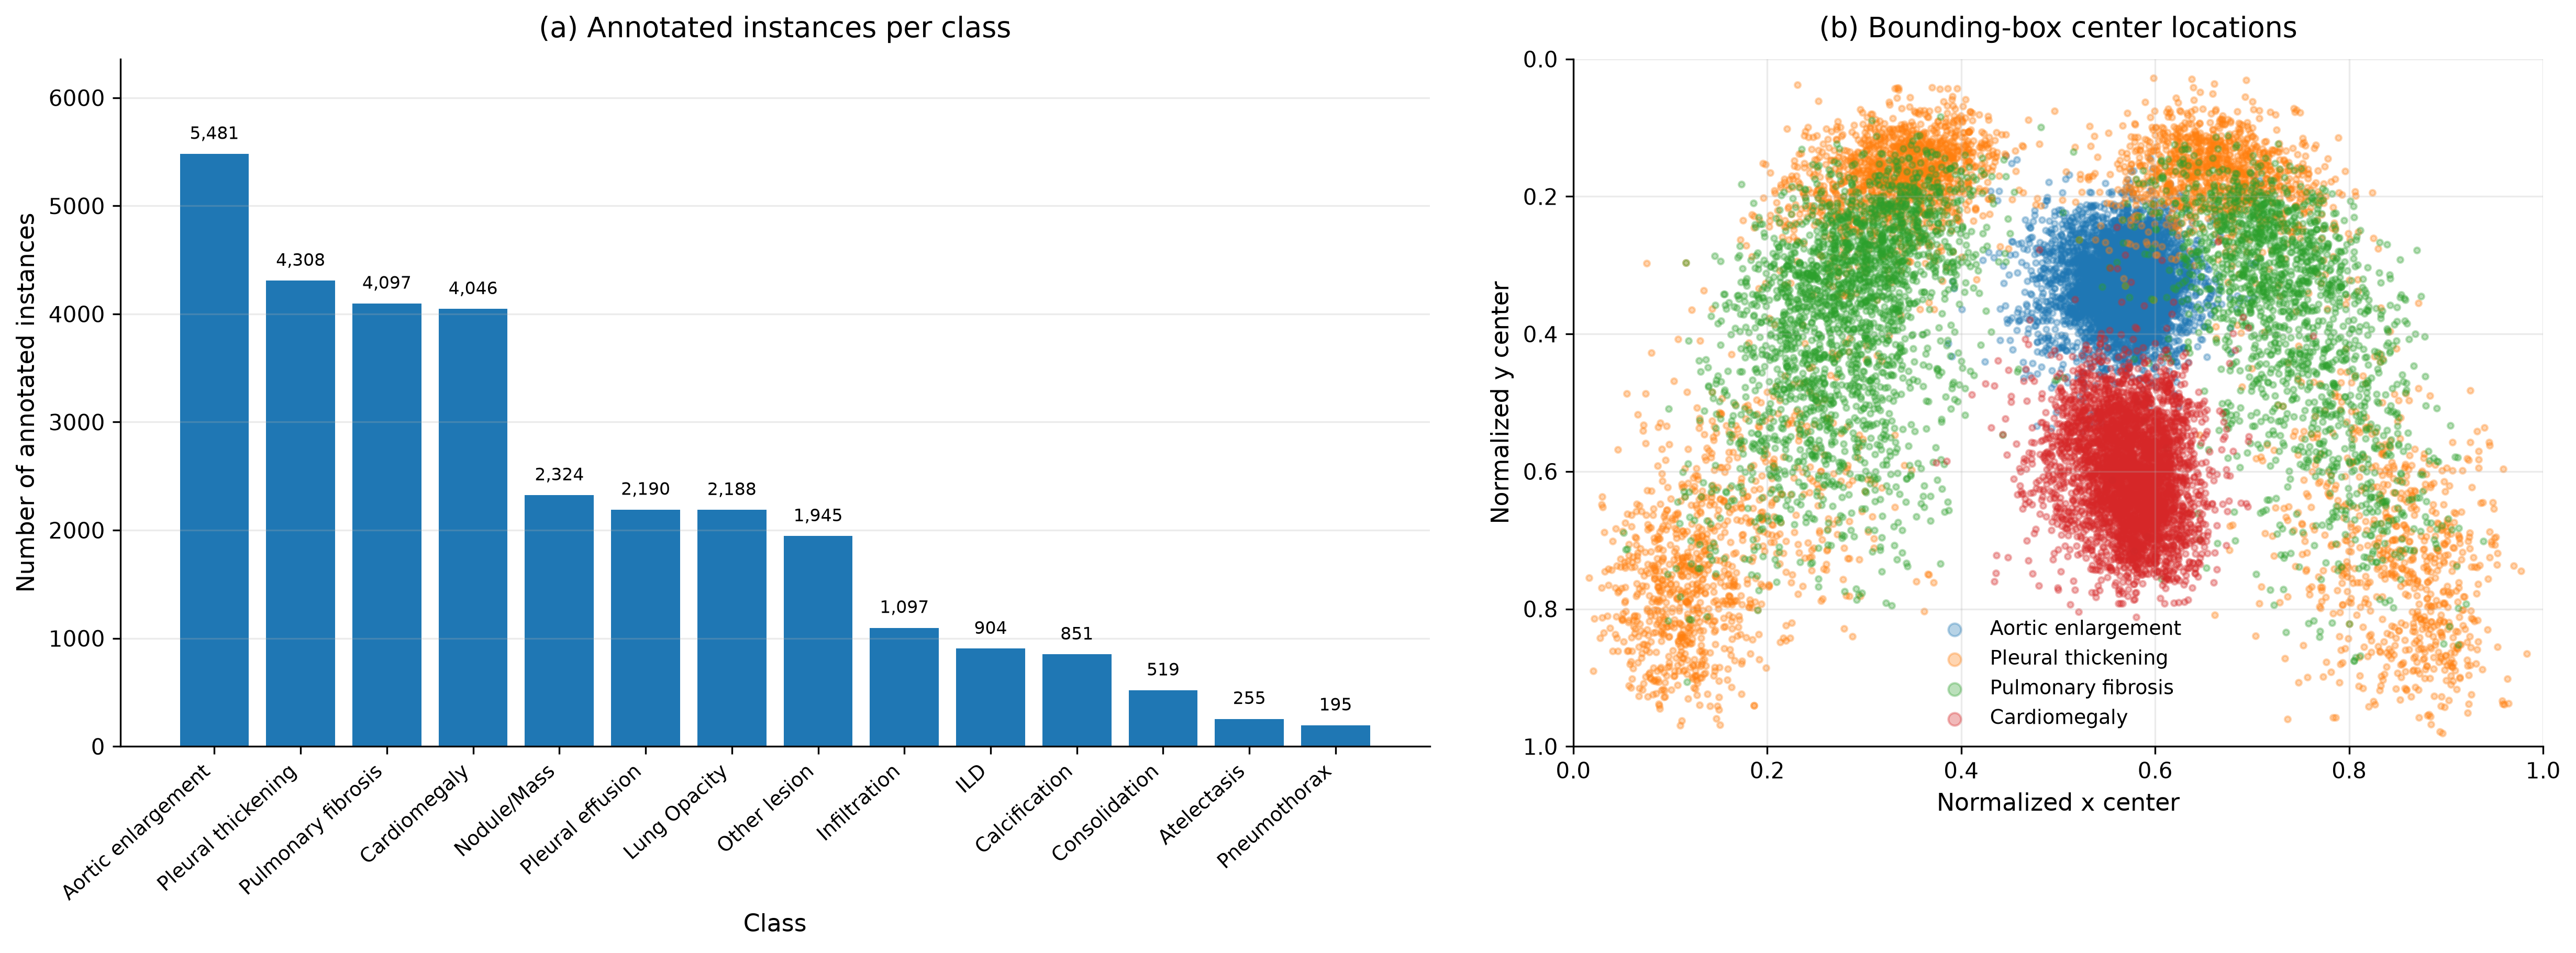
Figure 1. Training data characteristics.
(a) Number of annotated bounding-box instances per class, excluding the “No finding” class. The distribution is strongly imbalanced, with the most frequent classes represented by several thousand annotations and the rarest classes by only a few hundred. (b) Normalized bounding-box center locations for the four most frequent classes. The spatial distributions reflect the expected anatomical structure of chest radiographs, including mediastinal and lung-field localization, while also showing substantial overlap between selected classes. This illustrates both class-specific localization priors and the ambiguity faced by the object detection models.
RT-DETR baseline training and first leaderboard transfer
The first main detector family used in this work was RT-DETR-L at 640 px input resolution. RT-DETR was selected as the initial anchor architecture because it provided a strong transformer-based object detection baseline while remaining practical for repeated fold-level training, inference, and post-processing experiments.
The initial RT-DETR setup used the converted YOLO-format training data, 10-fold cross-validation, 80 training epochs, batch size 16, a 5-epoch warm-up, and the Ultralytics automatic optimizer selection, which selected AdamW for this configuration. Detector training was performed only on the 14 abnormality classes with explicit bounding-box annotations, while images without valid abnormality boxes were retained as background examples through empty label files.
Figure 2 shows the training dynamics for the representative fold00 RT-DETR-L ADAM run and the fold-to-fold behaviour of the same setup. The fold00 curves show rapid improvement during the first training epochs, followed by a noisier intermediate regime and a gradual plateau. This jumpiness is expected for object detection metrics: relatively small changes in confidence ranking or localization can move detections across IoU and confidence thresholds, producing visible epoch-to-epoch fluctuations. To show the training trend without hiding this variability, faint raw curves are shown together with smoothed curves.
Across the 10 folds, validation mAP50-95 followed a consistent overall pattern: fast early learning, slower refinement, and convergence toward a similar plateau. At the same time, the absolute fold-level trajectories remained meaningfully different. This fold sensitivity later became important for model selection and leaderboard transfer, because the best validation curve was not always the best competition anchor.
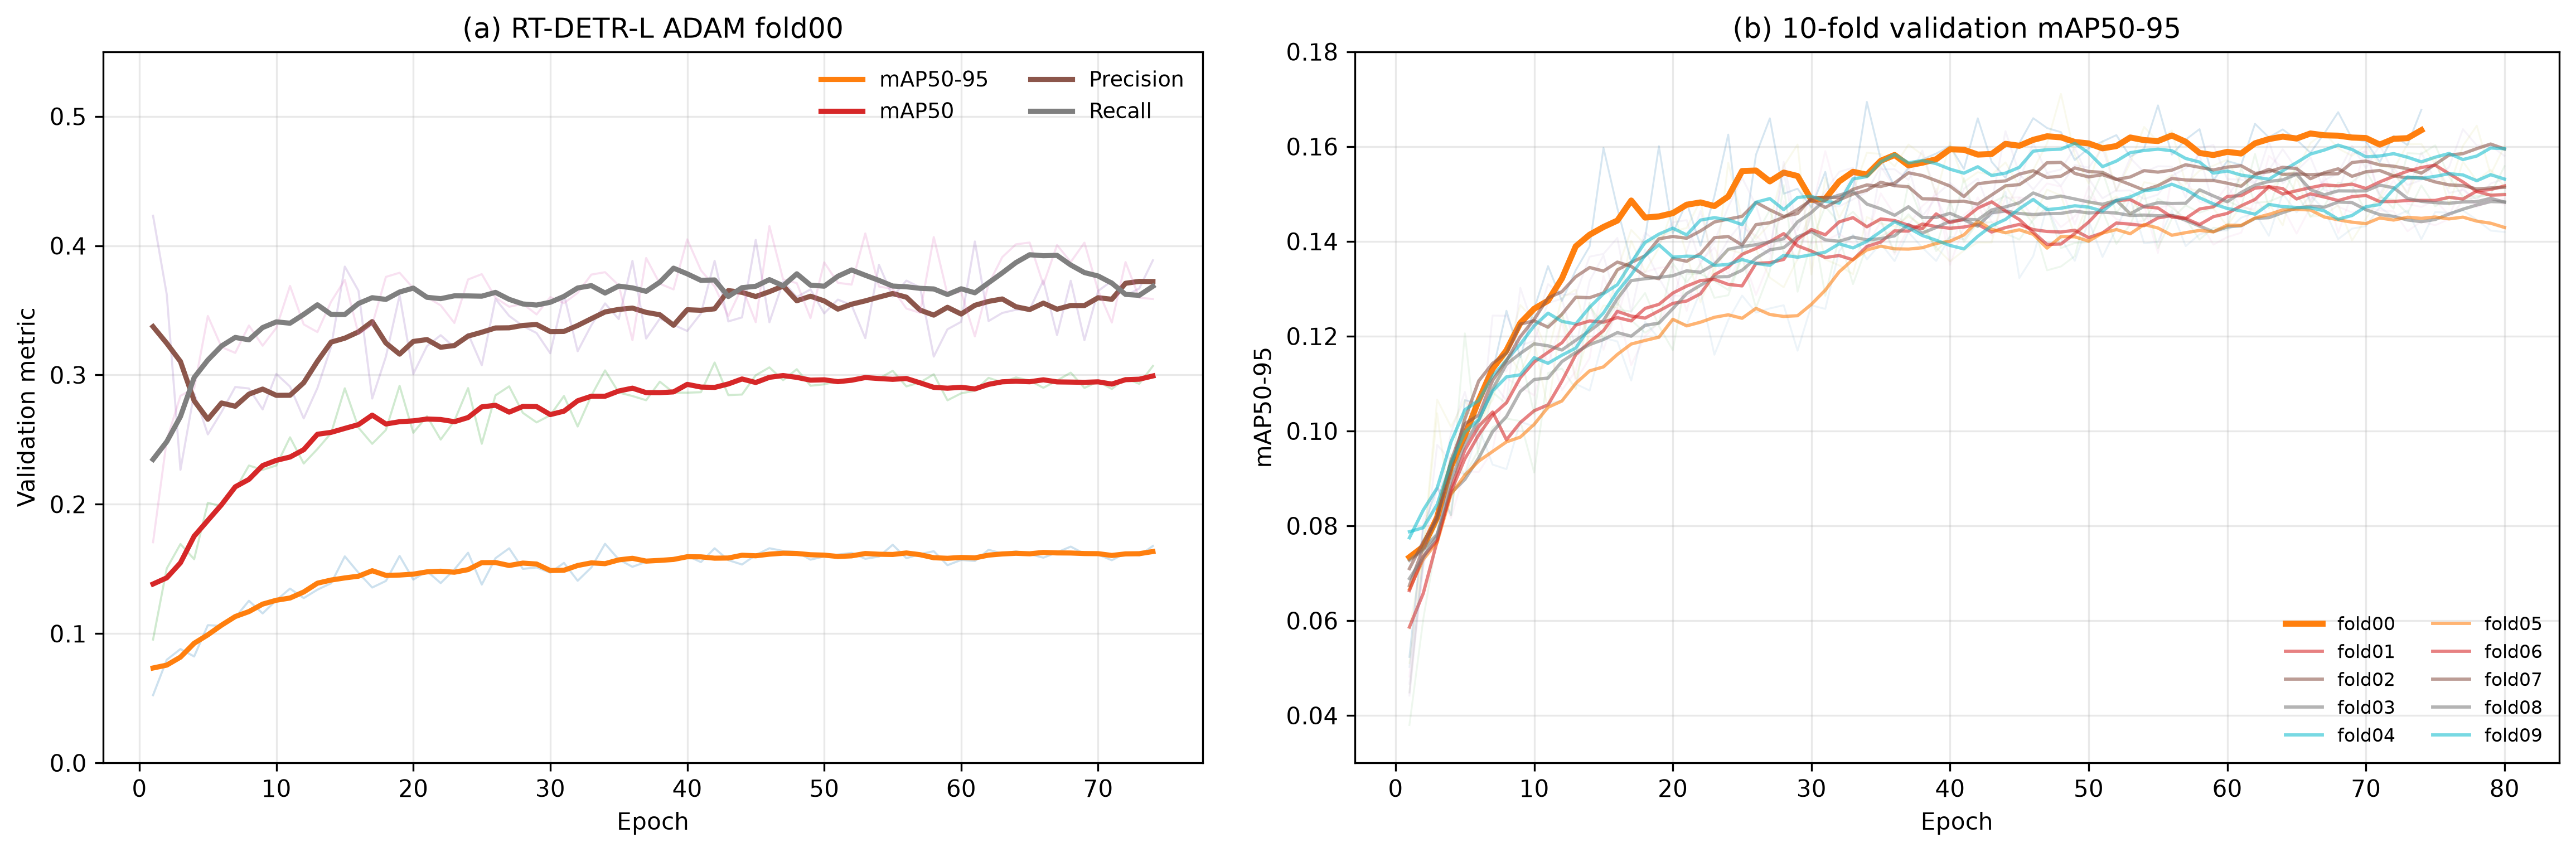
Figure 2. RT-DETR-L ADAM training dynamics and fold variability.
(a) Main validation metrics for the representative fold00 RT-DETR-L ADAM run. Thin semi-transparent lines show the raw epoch-by-epoch validation metrics, while thicker curves represent a centered 5-epoch moving average to emphasize the overall training trend while preserving the underlying variability. The detector exhibits rapid early improvement followed by a noisier refinement phase and eventual convergence toward a stable plateau. (b) Validation mAP50-95 trajectories for all 10 folds, displayed using the same visualization. The common trend indicates stable learning, while fold-specific differences illustrate the split sensitivity that later affected checkpoint selection and leaderboard transfer.
Table 1. RT-DETR-L baseline training configuration. Unless otherwise stated, all RT-DETR experiments used the configuration below. The MuSGD experiments employed the identical setup, differing only in the optimization algorithm.
| Setting | RT-DETR ADAM | RT-DETR MuSGD |
|---|---|---|
| Detector architecture | RT-DETR-L (Ultralytics) | RT-DETR-L (Ultralytics) |
| Input resolution | 640 × 640 px | 640 × 640 px |
| Number of classes | 14 | 14 |
| Cross-validation | 10-fold | 10-fold |
| Split seed | 42 | 42 |
| Training seed | 2 | 2 |
| Training epochs | 80 | 80 |
| Batch size | 16 | 16 |
| Optimizer | AdamW (Ultralytics automatic selection) | MuSGD |
| Initial learning rate | Automatically selected (≈5.56 × 10⁻⁴) | MuSGD default configuration |
| Warm-up | 5 epochs | 5 epochs |
| Learning-rate schedule | Custom plateau reduction | Custom plateau reduction |
| Early stopping patience | 40 epochs | 40 epochs |
| Confidence threshold (inference) | 0.05 | 0.05 |
| IoU threshold (inference) | 0.40 | 0.40 |
| Maximum detections per image | 300 | 300 |
MuSGD optimization and detector complementarity
Following the initial RT-DETR-L ADAM experiments, an alternative optimization strategy based on MuSGD was investigated while keeping the detector architecture and all remaining training settings unchanged (Table 1). The primary motivation was not necessarily to maximize validation mAP, but rather to investigate whether a different optimization trajectory would produce detector predictions that were complementary to the ADAM models.
Figure 3 summarizes the MuSGD training behaviour and compares its validation performance with the corresponding ADAM models. Similar to the ADAM experiments, all MuSGD folds exhibited stable convergence, characterized by rapid early improvement, a gradual refinement stage, and eventual saturation of validation performance. Although individual folds followed slightly different optimization trajectories, all converged to a relatively narrow performance range, demonstrating that the MuSGD optimization remained stable across the cross-validation splits.
A direct comparison of the best validation checkpoints (Figure 3b) shows that ADAM generally achieved slightly higher validation mAP50-95. Nevertheless, the difference remained relatively small for most folds, and MuSGD matched or slightly exceeded the ADAM performance in several individual cases. This observation suggests that both optimization strategies converge to similar but not identical local optima. Consequently, the resulting detectors should not be regarded simply as weaker and stronger versions of the same model, but rather as models with partially complementary prediction behaviour.
This complementarity later became useful during detector collaboration. Instead of replacing the stronger ADAM detector, MuSGD predictions were incorporated as an additional information source. Depending on the experiment, MuSGD detections could either contribute additional candidate bounding boxes (donor predictions) or provide independent support for confidence reranking of ADAM detections. The effectiveness of these support-based strategies is evaluated in the ensembling section of this report.
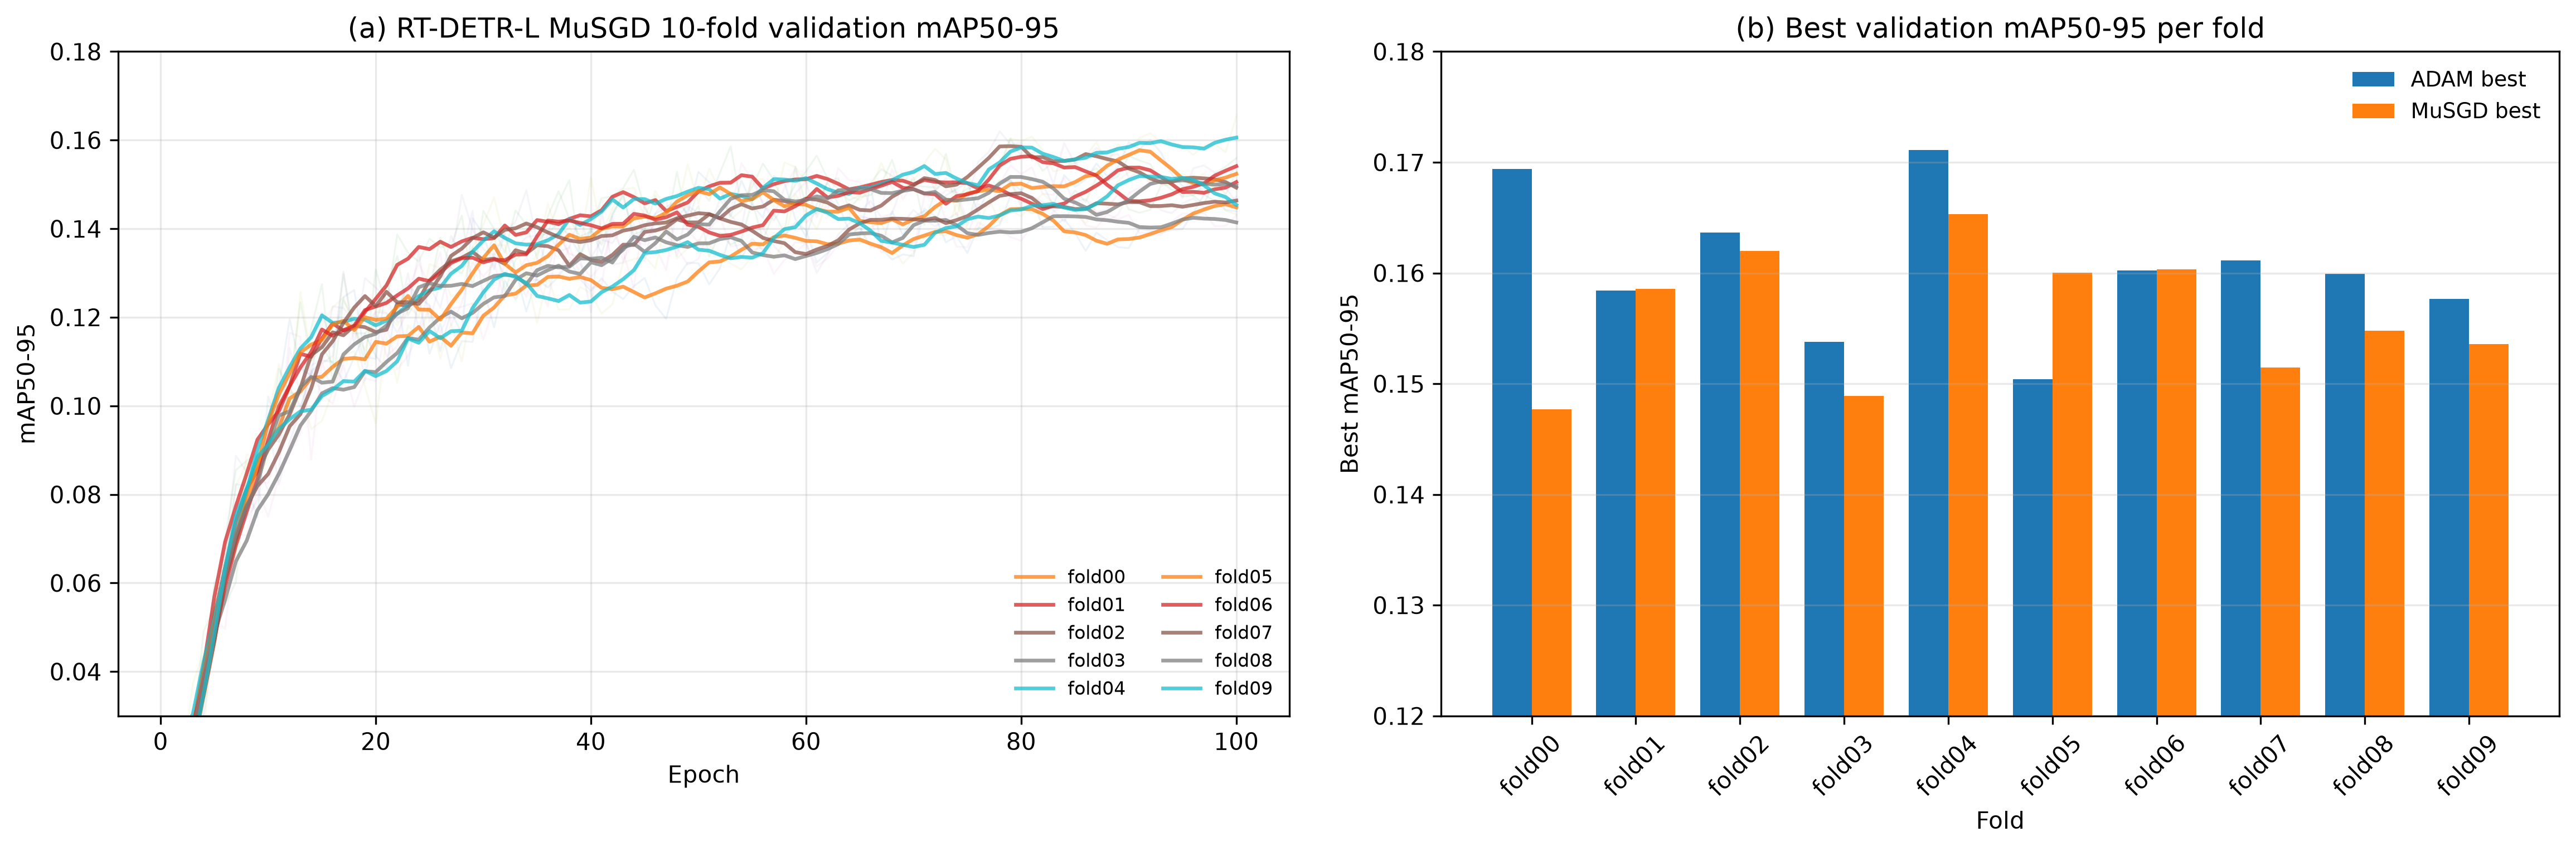
Figure 3. RT-DETR-L MuSGD training behaviour and comparison with ADAM.
(a) Validation mAP50-95 trajectories for the 10 MuSGD folds. Thin semi-transparent lines show the raw epoch-by-epoch validation values, while thicker curves represent a centered 5-epoch moving-average trend used solely to improve visualization. All folds exhibit rapid initial learning followed by a slower refinement phase and convergence toward a stable validation plateau. (b) Best validation mAP50-95 achieved by the corresponding ADAM and MuSGD models for each cross-validation fold. Although ADAM generally produced slightly higher validation performance, MuSGD remained competitive across all folds and matched or exceeded ADAM in several cases. These results indicate that the two optimization strategies converge to similar but distinct detector solutions, motivating the subsequent use of MuSGD predictions as complementary donor detections and independent support for confidence-based reranking.
DINO as a complementary detector family
In addition to RT-DETR, DINO with a ResNet-50 backbone was evaluated as a second transformer-based detector family. The DINO runs used the same 14 abnormality classes and stratified cross-validation structure, but relied on the MMDetection training and COCO-style evaluation pipeline. Internal validation scores were notably strong, with several folds reaching higher mAP50-95 values than the corresponding RT-DETR validation runs. However, this validation advantage did not transfer proportionally to the hidden leaderboard, where RT-DETR remained the stronger standalone competition anchor.
This discrepancy was treated as an important diagnostic result rather than as a simple model-selection failure. Because RT-DETR and DINO were trained and evaluated using different software frameworks, their validation metrics are not directly comparable. Nevertheless, DINO showed strong internal validation behaviour but transferred less effectively as a standalone leaderboard model, possibly because of differences in calibration, confidence ordering, class-wise behaviour, or sensitivity to the competition evaluation distribution. DINO was therefore retained primarily as a complementary detector family rather than as a replacement for RT-DETR.
Figure 4 summarizes the DINO training behaviour. At the fold level, DINO converged rapidly and reached a stable validation plateau. The class-wise trajectories show that different abnormalities behaved very differently: frequent and anatomically well-localized classes such as cardiomegaly and aortic enlargement achieved high AP early, while several ambiguous or lower-frequency findings remained substantially harder. Pneumothorax, despite being rare, showed a distinct later improvement phase. These class-specific differences supported the later use of DINO predictions as additional donor detections and as independent evidence for confidence-based reranking.
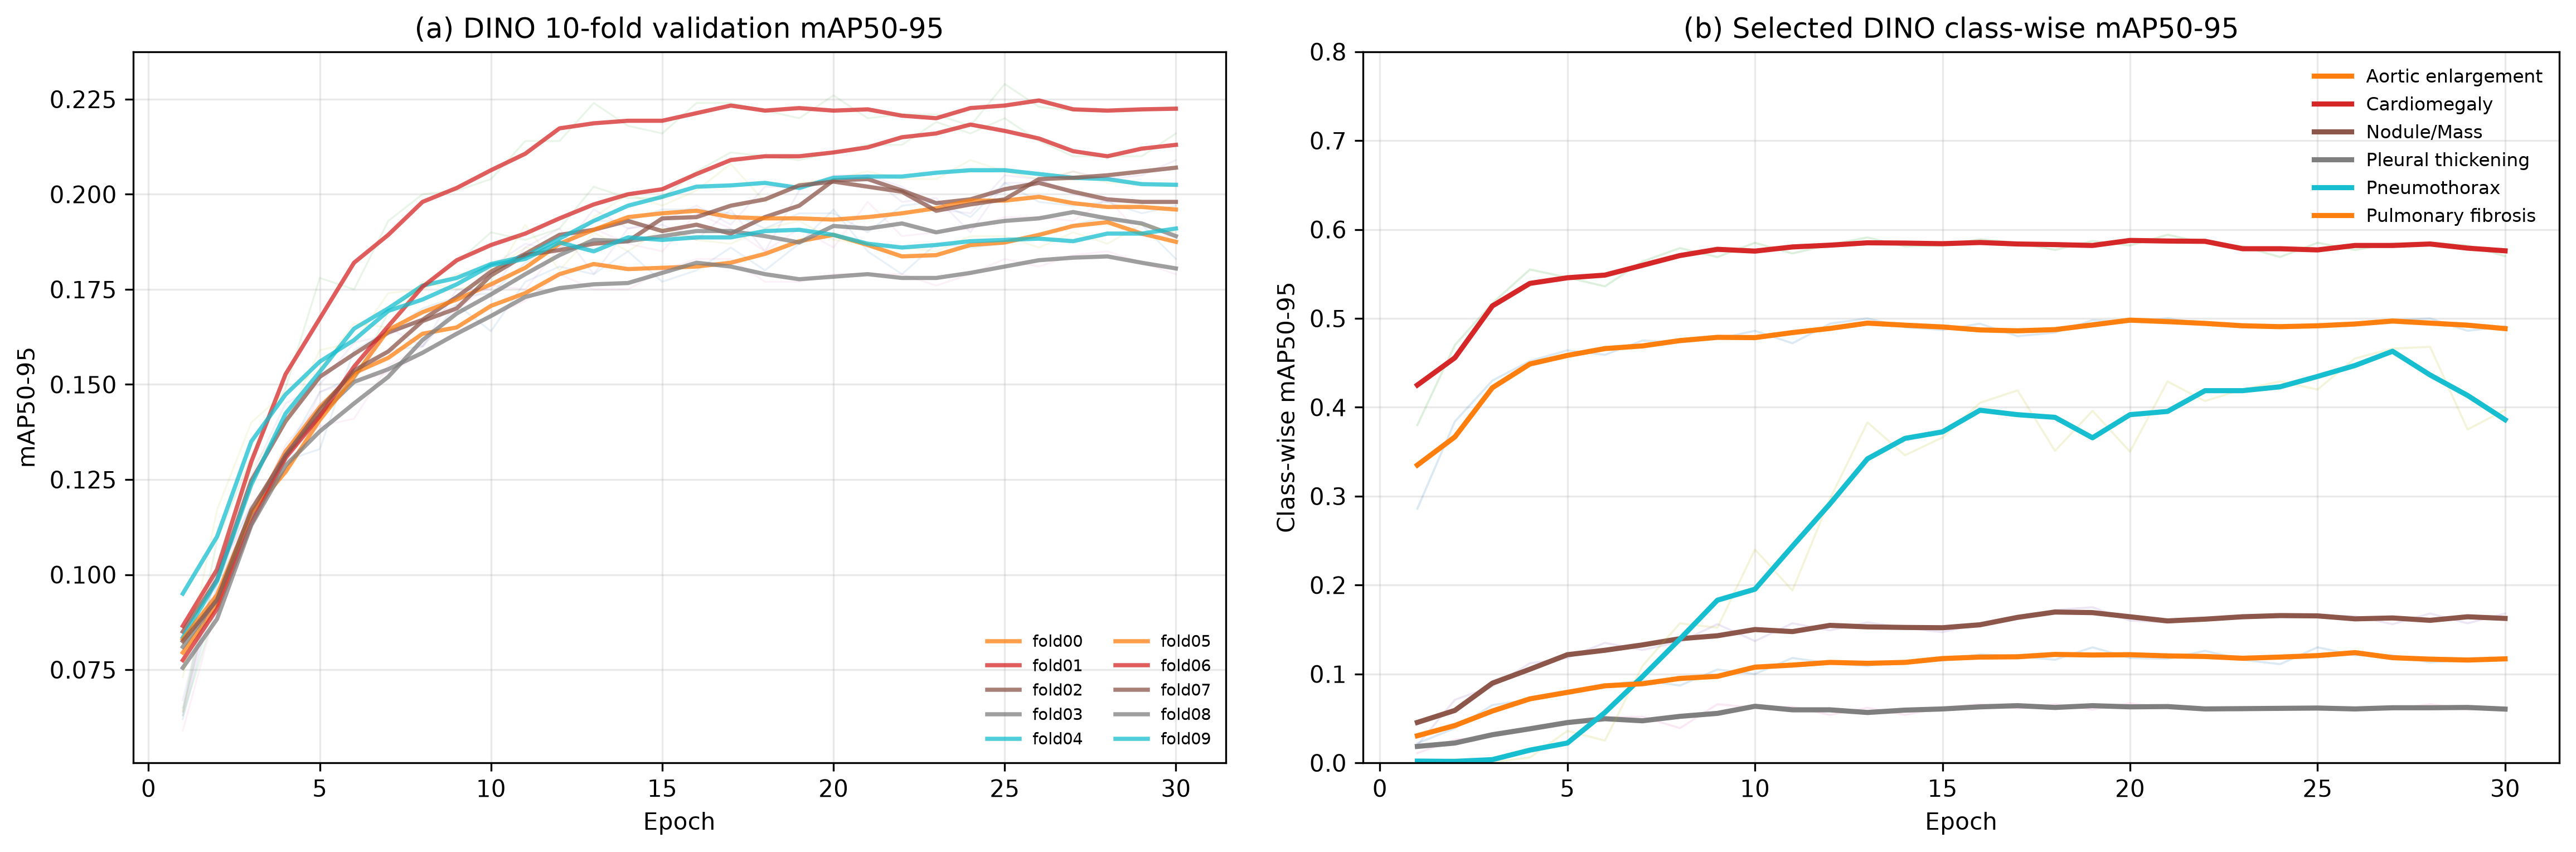
Figure 4. DINO validation behaviour and class-wise learning dynamics.
(a) Validation mAP50-95 trajectories for the 10 DINO folds. Thin semi-transparent lines show raw epoch-level values, while thicker curves show a centered 3-epoch moving-average trend used only for visualization. DINO converged rapidly and reached a stable validation plateau, with one fold showing particularly strong internal validation performance. (b) Class-wise mAP50-95 trajectories for selected representative classes, parsed from the MMDetection class-wise COCO evaluation log. The curves show substantial class-specific differences: cardiomegaly and aortic enlargement reached high AP early, several ambiguous findings remained lower, and pneumothorax improved later during training. This motivated using DINO as a complementary detector signal for donor selection and reranking rather than relying on it as a standalone replacement for RT-DETR.
DINO’s contribution to the final ensemble is summarized through the ensemble progression and discussed in the context of detector complementarity.
Ensemble construction and leaderboard progression
Starting from the selected RT-DETR ADAM fold00 leaderboard anchor, the final competition solution was incrementally constructed by exploiting complementary information across folds, optimizers and detector architectures. Rather than replacing the baseline detector, each subsequent stage introduced additional evidence only where it was supported by independent models or confidence refinement.
The optimization pipeline consisted of the following stages:
- RT-DETR ADAM baseline: selection of the RT-DETR ADAM fold00 model as the leaderboard anchor detector.
- Cross-fold support: incorporation of predictions from the remaining ADAM folds using consensus-based support while preserving the anchor predictions.
- MuSGD complementarity: exploitation of optimizer-specific prediction differences through donor selection and reranking.
- Refined MuSGD support: further optimization of support rules using confidence and overlap constraints.
- DINO support: incorporation of complementary detections from the DINO architecture using support-based reranking.
- Confidence calibration: optimization of the global confidence threshold (0.07) to improve precision while preserving recall.
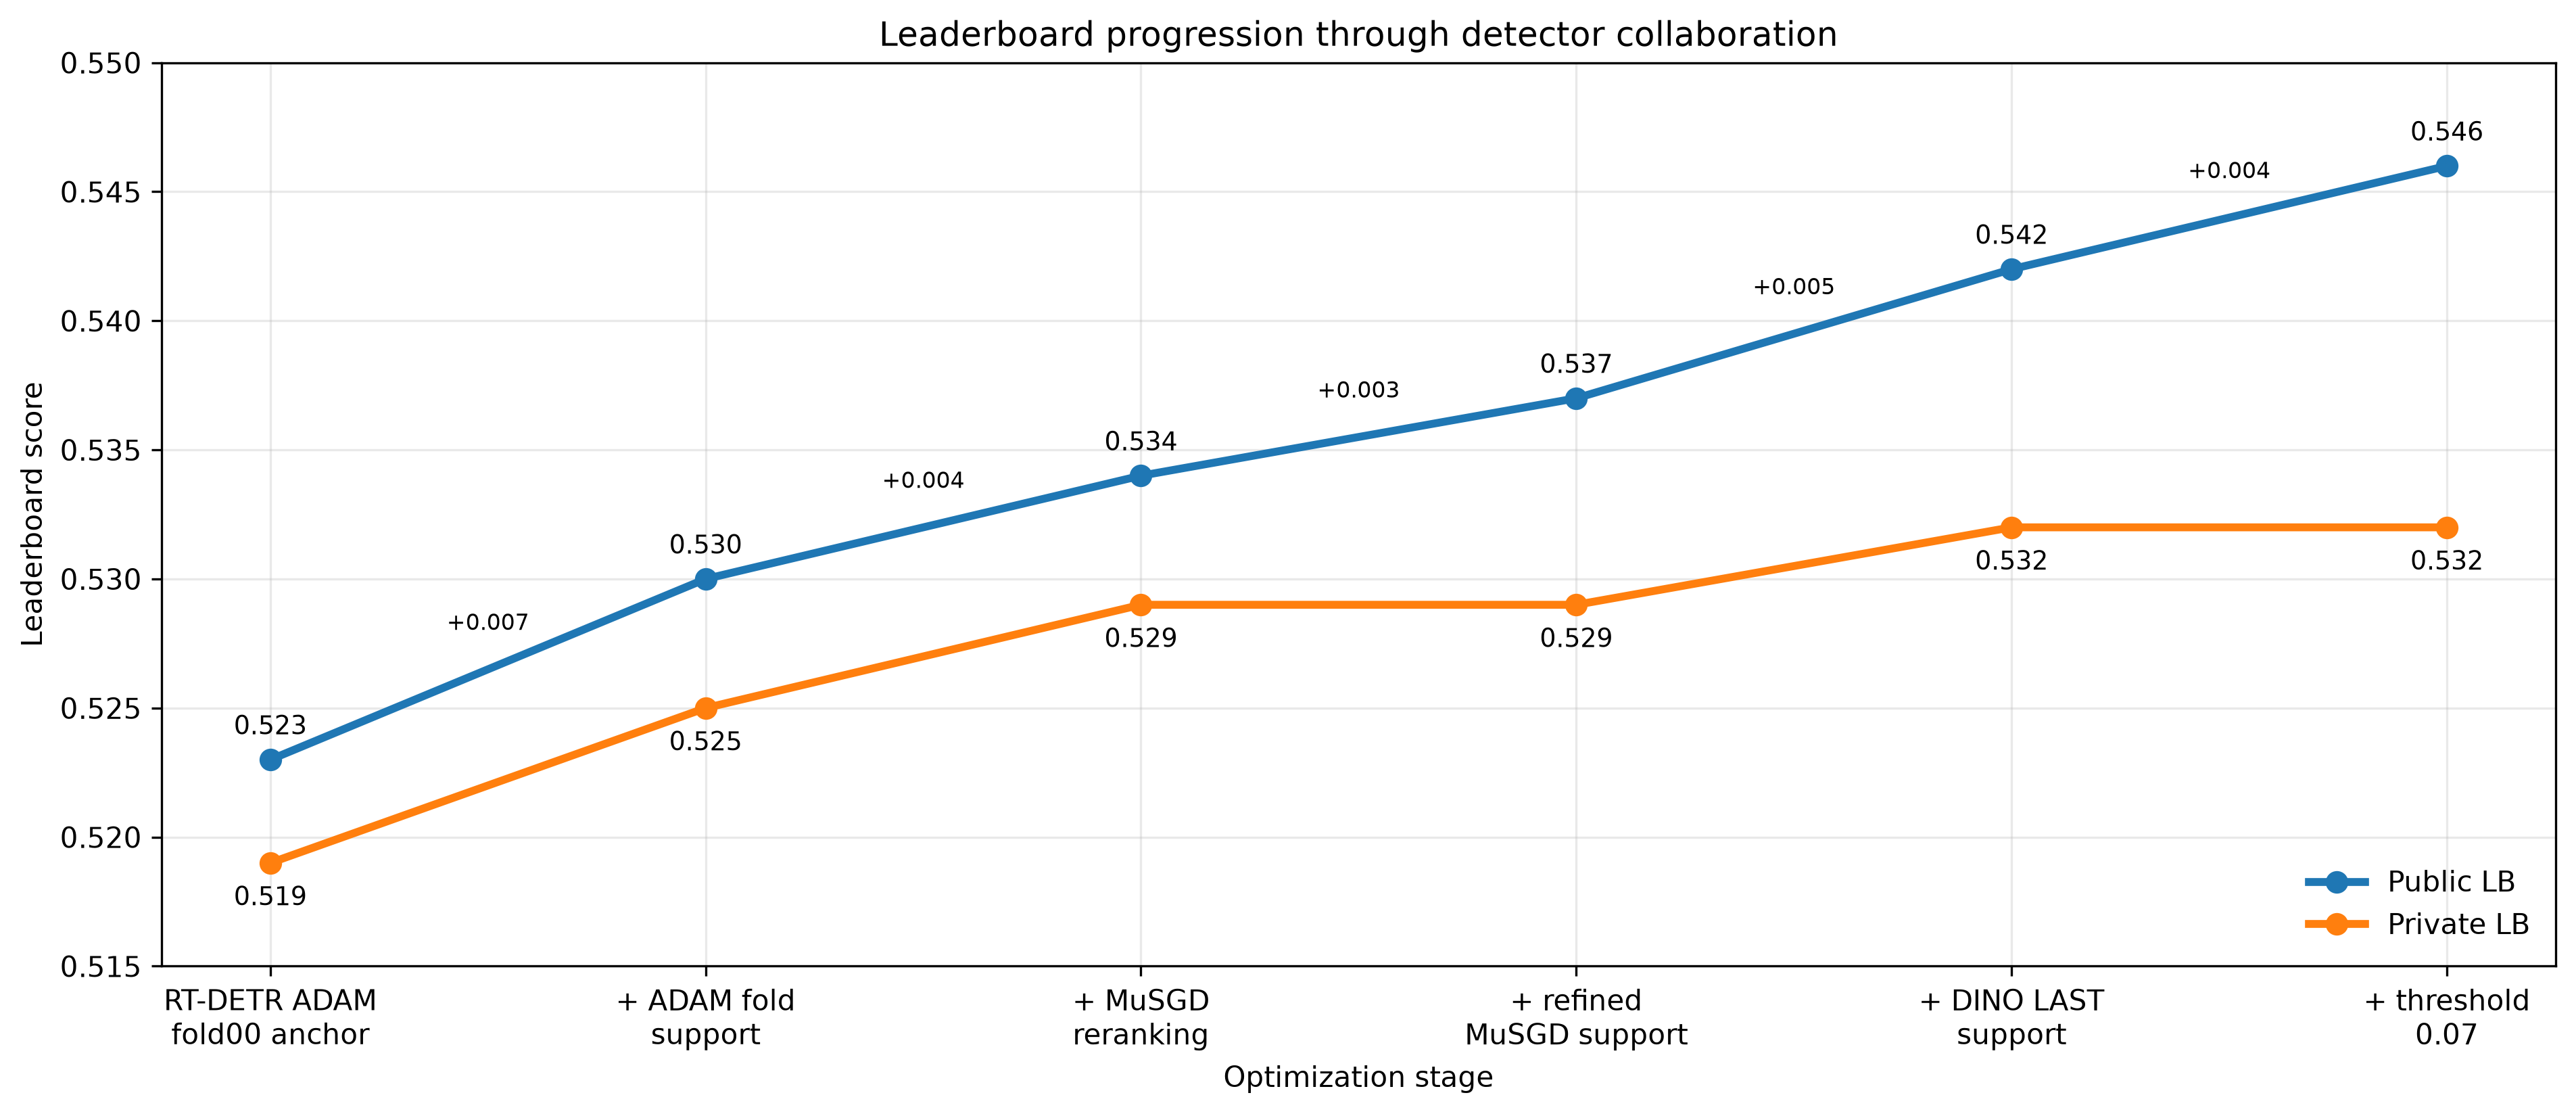
Figure 5. Incremental construction of the final ensemble.
The public and private leaderboard scores are shown after each major optimization stage. Numbers above the public leaderboard indicate the incremental improvement obtained at each step. The largest gain was achieved by incorporating complementary predictions from additional RT-DETR ADAM folds (+0.007), while optimizer diversity (MuSGD), architectural diversity (DINO), and confidence optimization produced further cumulative improvements, resulting in a final public score of 0.546 and a private score of 0.532.
The public and private leaderboards exhibit a highly consistent overall trend. Although individual optimization steps produced slightly different gains on the hidden evaluation set, every major stage either improved or preserved the private leaderboard performance. The largest discrepancy between the public and private scores is likely attributable to the limited size of the public test subset and fold-specific variability, where the validation fold that best matched the public leaderboard was not necessarily optimal for the hidden test set. Nevertheless, the consistent improvement (or preserved performance for private leaderboard) observed across both leaderboards indicates that the proposed ensemble strategy generalized beyond the public evaluation data.
The following sections analyze the underlying sources of complementarity that enabled these improvements, including cross-fold diversity within RT-DETR and optimizer-induced differences between ADAM and MuSGD training. These examples establish the underlying methodology, while subsequent detector combinations, including DINO-based reranking, follow the same general principles and therefore are only summarized in the overall optimization pipeline.
The cross-fold diversity and fold-based support
After establishing a strong single-model baseline with the RT-DETR ADAM fold00 detector, the next objective was to investigate whether independently trained cross-validation folds contained complementary information that could further improve the predictions. Rather than averaging all fold outputs directly, the selected fold00 model was treated as a fixed anchor, while the remaining nine folds were interpreted as an independent source of candidate detections. This strategy was motivated by the observation that different folds occasionally detected lesions that were consistently missed by the anchor while simultaneously producing substantial amounts of redundant or low-confidence predictions.
To exploit this complementary information, candidate detections from the remaining folds were filtered using several increasingly selective criteria. Only predictions that were novel with respect to the anchor, satisfied class-specific confidence thresholds, were supported by multiple independent folds, and survived non-maximum suppression were retained. Consequently, only a few hundred high-confidence donor detections were finally merged with the anchor prediction instead of directly combining millions of raw predictions. This transformed cross-validation from a purely model-selection procedure into an additional source of complementary detection evidence.
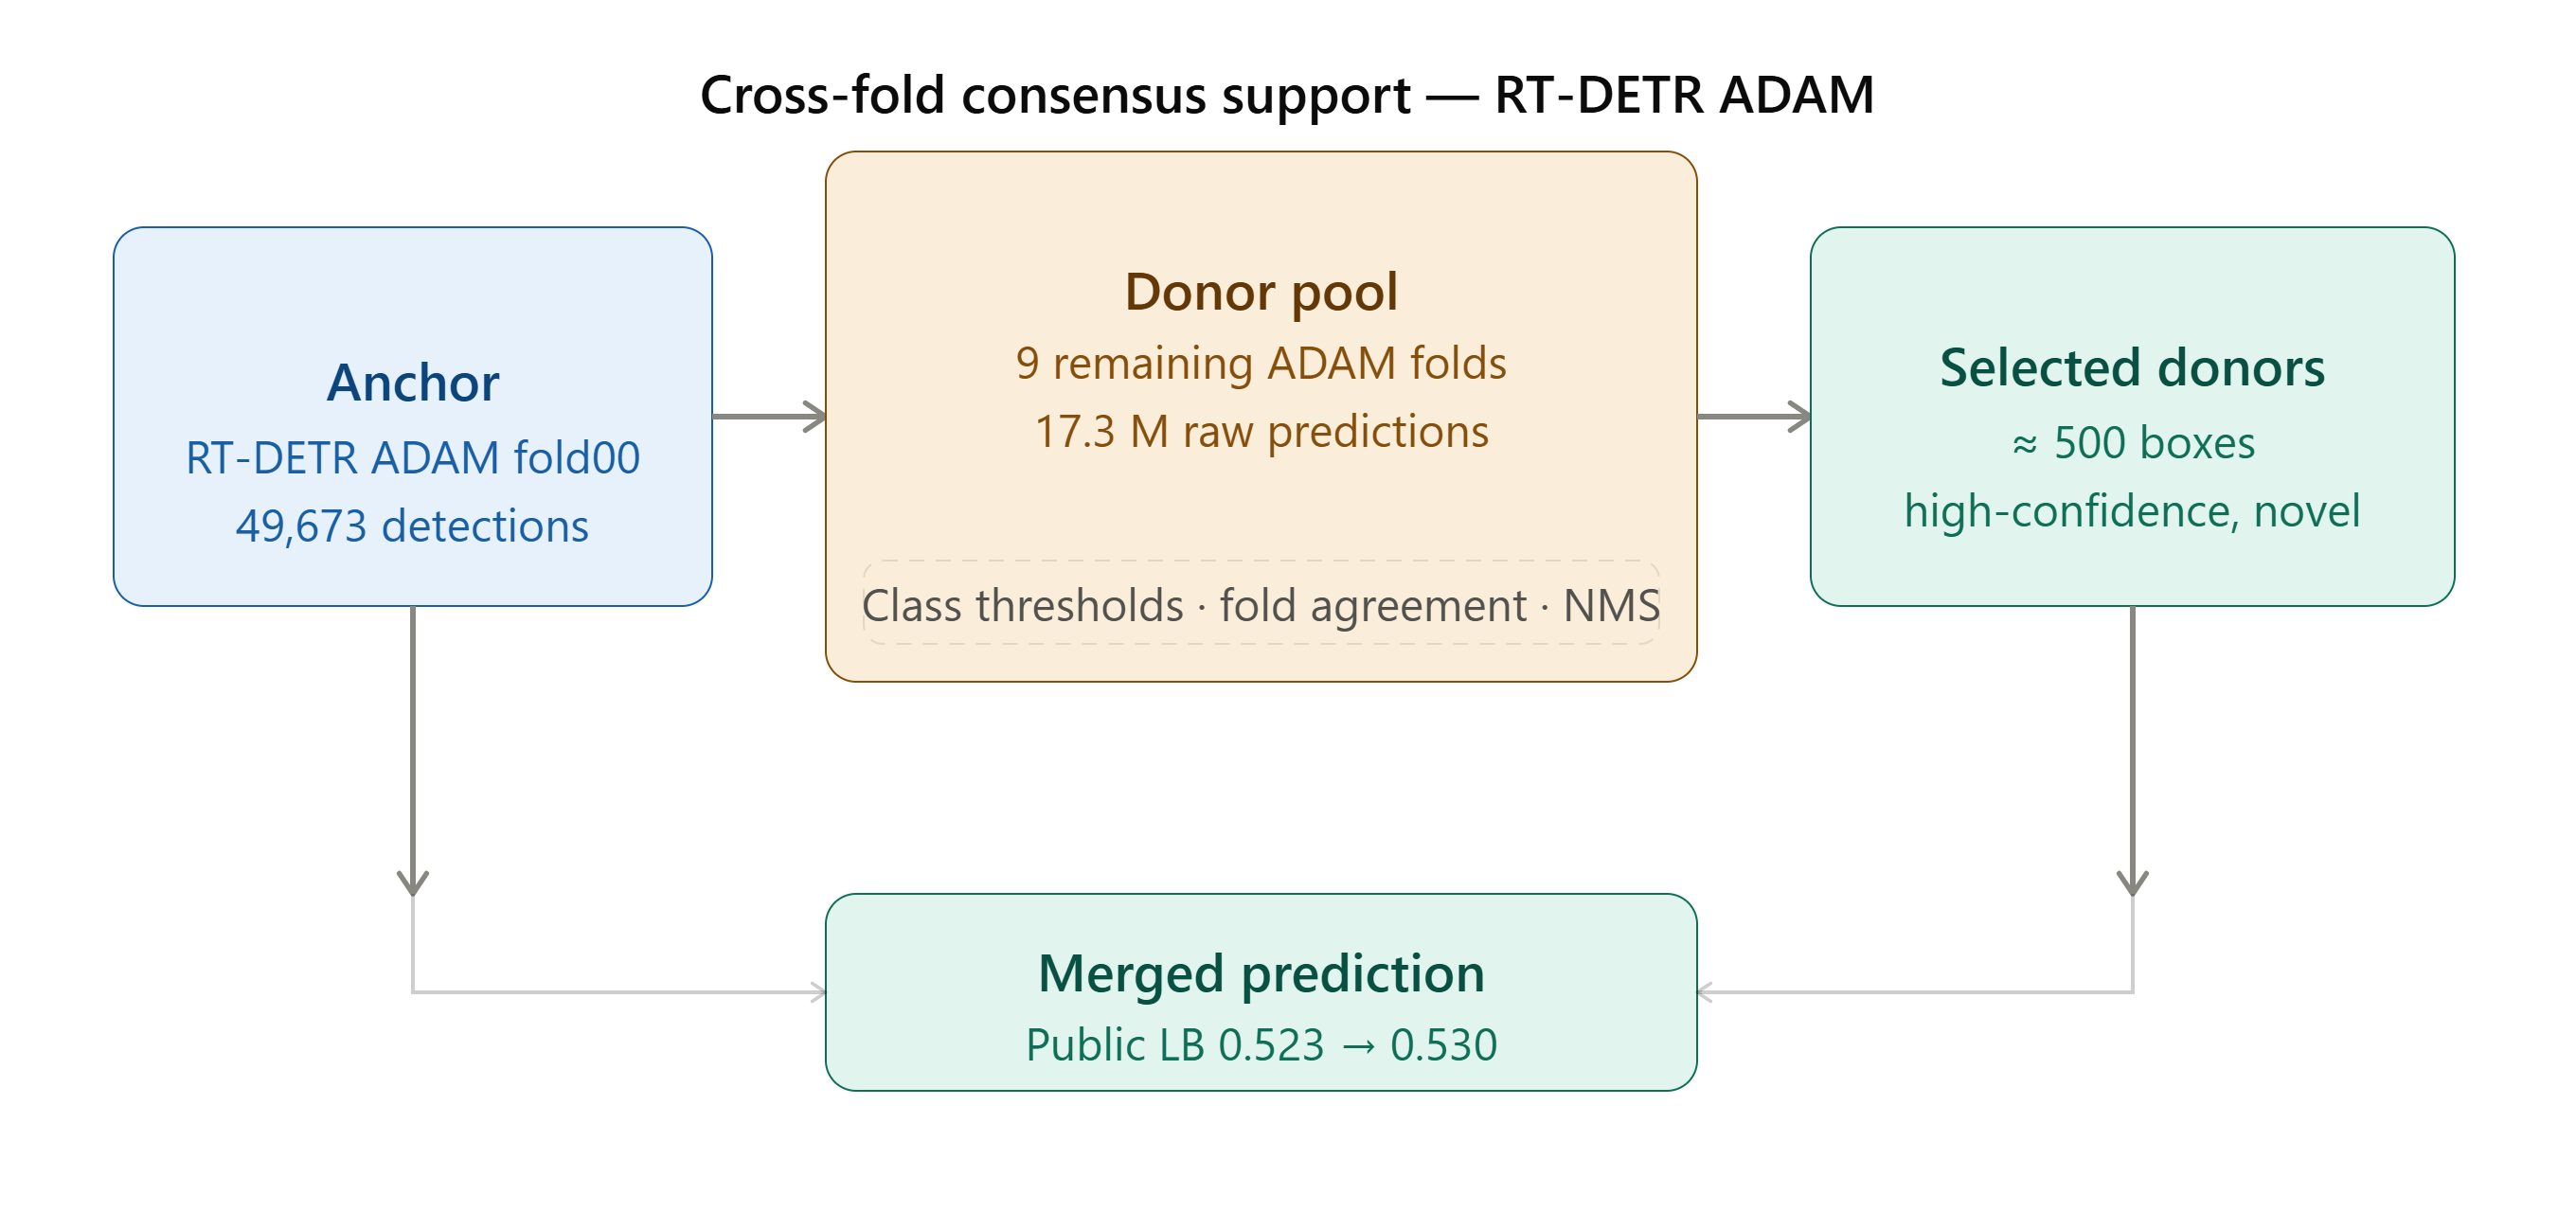
Figure 6. Cross-fold consensus support for RT-DETR ADAM.
The strongest RT-DETR ADAM model (fold00) was used as the anchor prediction. The remaining nine cross-validation folds were interpreted as a donor pool containing complementary candidate detections rather than being merged directly. After applying class-specific confidence thresholds, requiring agreement across multiple folds, and performing non-maximum suppression, approximately 500 high-confidence novel donor boxes were selected and merged with the anchor prediction. This selective consensus strategy improved the public leaderboard score from 0.523 to 0.530 while preserving the high precision of the anchor detector.
This experiment demonstrated that independently trained folds contain complementary information despite sharing the same network architecture and training configuration. More importantly, the improvement was achieved not by increasing the total number of predictions, but by selectively incorporating only well-supported novel detections. This observation established the central principle used throughout the remainder of this work: complementary detectors are most effective when they provide independent supporting evidence for candidate detections rather than when all predictions are fused indiscriminately. The following sections extend this idea first to complementary optimization strategies (ADAM versus MuSGD) and subsequently to architecturally different detectors (DINO), ultimately leading to the final ensemble and reranking pipeline.
MuSGD-based confidence reranking
After establishing the RT-DETR ADAM fold00 model as the primary detection anchor, the next objective was to exploit complementary information from the independently trained MuSGD models. Rather than directly merging all predictions, MuSGD detections were used as supporting evidence for existing ADAM detections. For every ADAM bounding box, same-class MuSGD predictions with sufficient confidence and spatial agreement were identified. The confidence score of the ADAM detection was then increased proportionally to the number of supporting MuSGD folds, while the bounding-box geometry itself remained unchanged. This strategy preserves the localization quality of the anchor detector while selectively increasing confidence only for detections independently confirmed by another optimization trajectory.
Figure 7 summarizes both the coverage of this support mechanism and its validation performance. The left panel shows that the proportion of ADAM detections receiving MuSGD support decreases gradually as the required overlap becomes more restrictive. At an IoU threshold of 0.50, approximately 61% of all ADAM detections receive additional support, whereas only about 25% remain eligible at an IoU threshold of 0.85. At the same time, the average confidence increase applied to reranked detections decreases only moderately (from approximately +0.077 to +0.050), indicating that supported detections consistently receive meaningful confirmation across a broad range of overlap requirements.
The right panel demonstrates that this confidence reranking translates into a measurable validation improvement. The validation mAP remains consistently above the ADAM baseline for all tested overlap thresholds, with the strongest performance observed for moderate overlap requirements (approximately IoU 0.50–0.65). Increasing the overlap requirement further results in a gradual reduction in validation performance, suggesting that excessively strict geometric agreement removes useful complementary detections rather than improving prediction quality. Importantly, the validation curve remains relatively flat across moderate IoU values, indicating that the reranking procedure is robust and does not require precise tuning of the overlap threshold.
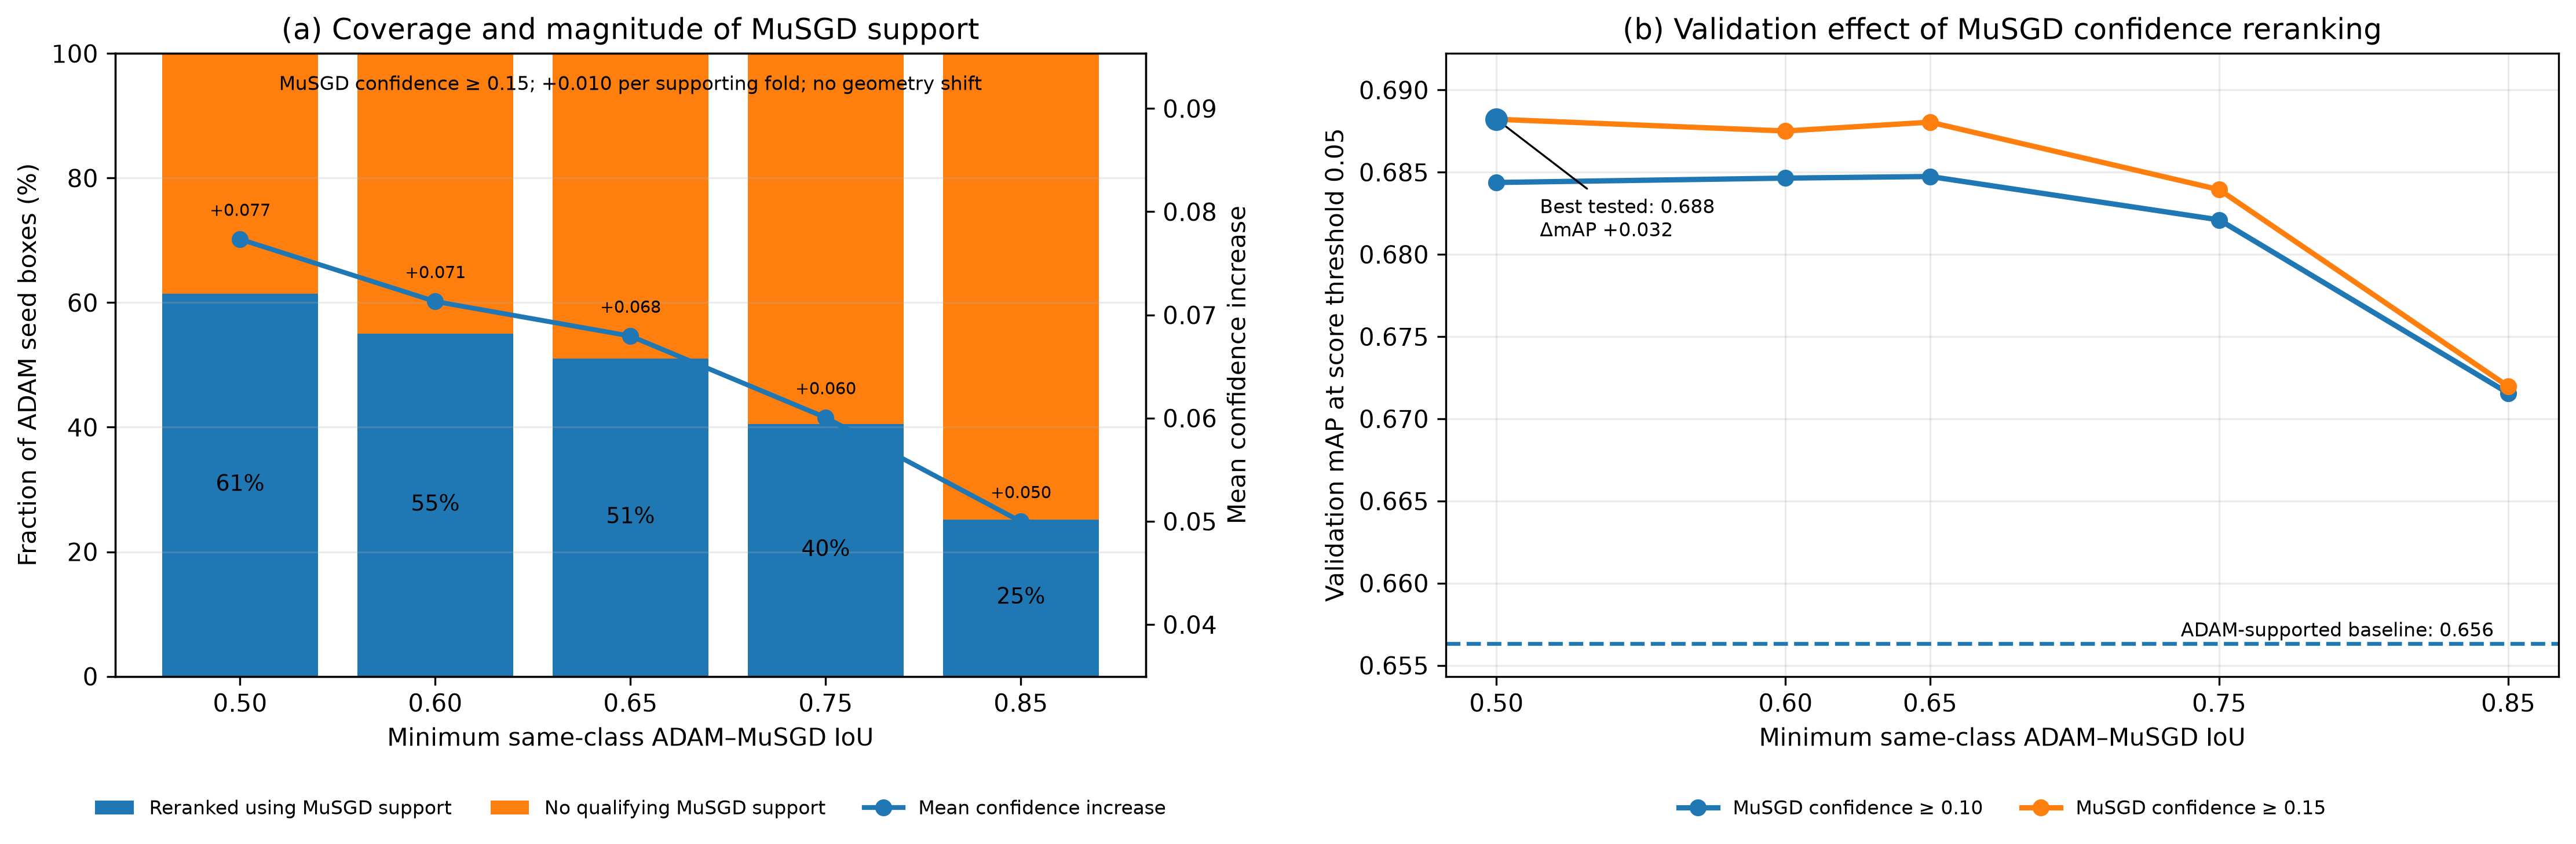
Figure 7. MuSGD-based confidence reranking of RT-DETR ADAM predictions.
(a) Fraction of ADAM detections receiving confidence support from MuSGD predictions as a function of the minimum same-class IoU requirement. The line indicates the average confidence increase applied to reranked detections. (b) Validation performance obtained after confidence reranking for different MuSGD confidence thresholds and overlap requirements. The dashed horizontal line denotes the original ADAM-supported baseline. Moderate overlap thresholds (IoU ≈ 0.50–0.65) consistently provide the strongest validation performance, demonstrating that complementary MuSGD predictions improve confidence calibration without modifying the underlying bounding-box geometry.
The observed validation improvement supports the hypothesis that independently optimized RT-DETR models capture partially different confidence distributions while producing highly compatible object localizations. Consequently, MuSGD acts primarily as a confidence calibrator rather than as an additional localization model. This finding motivated extending the same general concept to a substantially different detector architecture, DINO, which was later incorporated into the ensemble using the same support-based principles.
Vision language models and image-level classification
Beyond the transformer-based detection pipeline, two additional modelling directions were explored. MedGemma was evaluated for semi-automatic annotation refinement and dataset cleanup. While this improved internal validation consistency, the improvement did not transfer to the hidden leaderboard, consistent with the broader distribution differences suggested by the validation and leaderboard analyses.
Image-level classification was also investigated as an additional post-processing signal. Custom convolutional neural networks were trained to predict image-level abnormalities, and their outputs were used to downscale the confidence of low-probability detections. Several conservative confidence-adjustment strategies were evaluated, but none improved leaderboard performance. Together, these negative results reinforce an important observation of this work: improvements observed on the validation set do not necessarily translate to improved performance on the hidden evaluation set, potentially reflecting differences between the validation and hidden evaluation distributions.
Summary and outlook
This work developed and analyzed a multi-class chest X-ray object-detection pipeline for the AMIA 2026 Imaging Informatics Challenge. Starting from a single RT-DETR-L ADAM model, the final solution was constructed incrementally by exploiting complementary information across cross-validation folds, optimization strategies, and detector architectures. The resulting pipeline achieved a public leaderboard score of 0.546 and a final private score of 0.532, corresponding to a 3rd-place finish on the private leaderboard.
The central finding is that detector diversity was most useful when treated as a source of selective supporting evidence, rather than through indiscriminate prediction fusion. Predictions from additional ADAM folds contributed carefully filtered donor detections that were absent from the anchor model. MuSGD models, trained with the same architecture but a different optimization trajectory, provided independent confirmation for confidence-based reranking of existing detections. DINO introduced a further source of architectural and class-specific diversity and produced additional improvements when used as a complementary support model. In contrast, conventional fusion and aggressive post-processing were generally less effective under the investigated settings.
Several broader conclusions emerged from the experiments:
- Cross-validation folds contain useful predictive diversity. Independently trained folds can identify lesions missed by the selected anchor, but their contribution must be filtered using confidence, novelty, spatial agreement, and consensus.
- Optimization trajectories influence detector behaviour. ADAM and MuSGD produced similar validation performance but meaningfully different confidence rankings, allowing one optimizer family to support another.
- Validation performance alone was not sufficient for model selection. DINO achieved stronger internal validation mAP than RT-DETR in several folds, yet transferred less effectively as a standalone leaderboard model.
- Class-wise behaviour differs substantially. Individual abnormalities exhibited different learning trajectories, convergence rates, and achievable AP, suggesting that detector collaboration and calibration may benefit from class-specific treatment.
- Confidence reranking was more reliable than naive fusion. Preserving anchor geometry while modifying confidence according to independent detector support provided a robust mechanism for improving detection ranking.
- Annotation and evaluation distributions matter. VLM-based annotation refinement and image-level confidence gating improved aspects of internal validation but did not improve hidden-test performance, emphasizing the limitations of validation-driven optimization under annotation-protocol mismatch.
The two detailed collaboration examples presented in this report (cross-fold donor selection and MuSGD-based confidence reranking) illustrate the general principles underlying the final ensemble. Additional combinations, including DINO-based support, targeted consensus rules, class-dependent calibration, and the final confidence-threshold adjustment, followed the same broader strategy and are summarized through the leaderboard progression rather than reproduced as separate exhaustive studies.
Future directions
Several natural extensions follow from these results. A first direction is the development of a more systematic class-aware calibration framework, in which support thresholds, confidence increments, and detector weights are learned or validated separately for each abnormality class. The strong differences in class-wise DINO performance suggest that a detector may be valuable for a subset of findings even when it is not the strongest global model.
A second direction is to replace hand-designed support rules with a learned collaboration model. Features such as detector confidence, fold agreement, localization overlap, class identity, checkpoint stage, and prediction geometry could be used by a lightweight meta-model to estimate whether a detection should be retained, reranked, or rejected. Such a model would generalize the support-based strategy while preserving interpretability and could be evaluated under nested cross-validation to reduce overfitting to a single validation split.
The observed validation-to-leaderboard discrepancy also motivates more detailed study of distribution shift and annotation variability. Multi-annotator modelling, uncertainty-aware evaluation, and explicit estimation of annotation disagreement could help distinguish genuine model errors from acceptable alternative localizations. These questions are particularly relevant in medical imaging, where a single deterministic bounding box may not fully represent clinical or annotator uncertainty.
Finally, the VLM and image-level experiments indicate promising but unresolved directions for multimodal supervision. Vision language models may be better suited to annotation review, structured error analysis, uncertainty assessment, and prioritization of ambiguous cases than to direct automatic label replacement. Combining detector outputs with radiological text representations or expert review could provide a stronger foundation for future dataset refinement and clinically grounded model evaluation. Overall, the experiments demonstrate that performance gains in medical object detection can arise not only from increasingly complex standalone models, but from understanding how independently trained models differ and how their evidence can be combined selectively.